
EA Verdict #10
Waka Waka EA Review (2026): The $2,800 Grid With an 8-Year Signal, 72% Equity Drawdown and a Warning on Its Own Page
By Benjamin Lee · Updated · 23 min read
Waka Waka is one of the best-known grid Expert Advisors on the MQL5 Market. It trades three Australian and New Zealand dollar pairs on a 15-minute chart, costs $2,800, has been on sale since 2021, and points to a live signal with 436 weeks of history and 5,515 trades. That is far more proof than most listings offer. The same signal also carries a platform notice that subscription is not permitted because 'current drawdown is dangerous for subscribers', and a drawdown warning that has been switched on and off every few days since 30 September. We read the listing, 20 of its 44 reviews and every developer reply, opened the signal and scored Waka Waka on the same eight criteria as every verdict here. The result is 46.5 out of 100 and a High risk label: a long record and a transparent input list, set against a design whose losses arrive all at once.
Key takeaways
- Waka Waka scores 46.5 out of 100 (band: Weak) with a High risk label. A grid with trade multipliers cannot be rated better than High; the long record keeps the evidence score near the middle of its tier.
- The vendor's MQL5 signal 995287 (MT4, IC Markets) shows +384% over 436 weeks, 5,515 trades, a 74% win rate and a profit factor of 1.70. Balance drawdown is 12.6% to 13.9%, but equity drawdown is 72.4%, and on 20 October the platform flagged a current drawdown of 30%.
- The signal page says subscription is 'not permitted' because the current drawdown is dangerous for subscribers, and that trading style has changed and earlier history is not counted. The vendor's '+12,000% over 8 years' headline is not on the signal; the platform shows +384% and a monthly growth figure of 0.14%.
- The average win is 9.99 USD and the average loss 16.79 USD. A 74% hit rate carries the system until a basket goes deep; the single worst trade was 541.76 USD, 54 times the average win.
- We sell a listing for Waka Waka, and it shows the same version, 4.59, as the Market. Treat it as a separate purchase with its own price and terms.
- 46.5 / 100
- weighted verdict score on eight published criteria
- 72.4%
- relative drawdown by equity on the vendor's 436-week MQL5 signal, against 13.9% by balance
- $2,800
- Market price on 21 Oct 2026, purchase only; the signal page says subscription is not permitted at the moment
The verdict at a glance: the longest record on the list, and the deepest drawdown
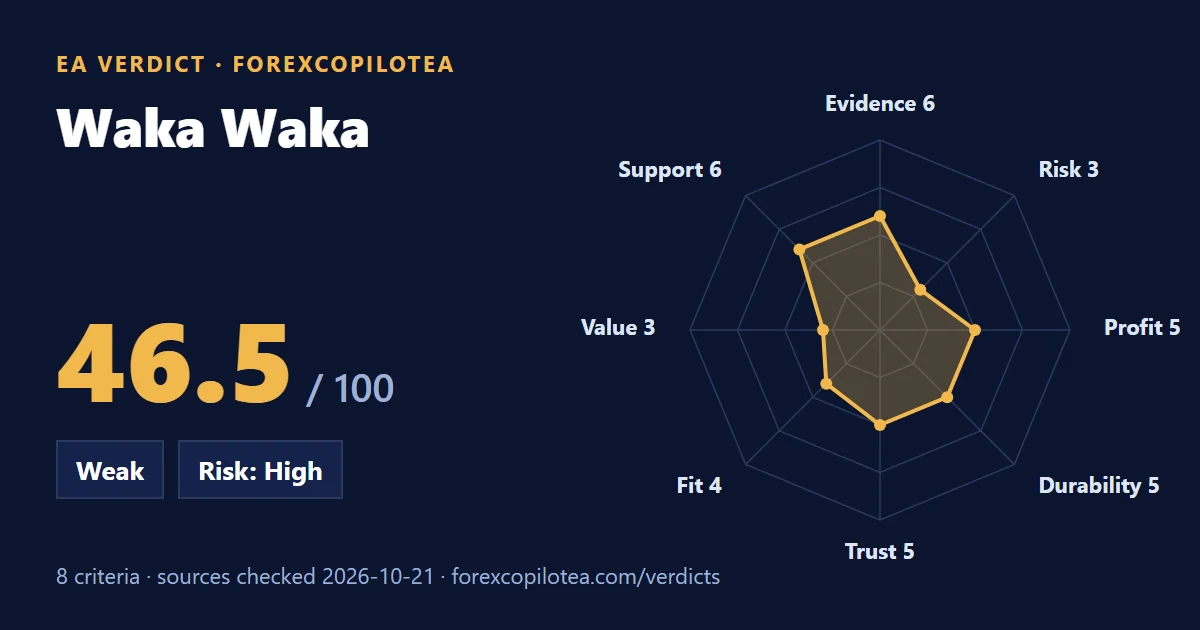
Waka Waka earns points for how much it shows. A signal with 5,515 trades over years is a different class of evidence from a ten-week account, and the listing is more open about its inputs than most. It loses points on risk, which is where a grid is always judged, and where the signal's own numbers are least comfortable. The scorecard and radar show how the total was built.
46.5 / 100
Weighted verdict score
Weak
Verdict band
High
Risk label
| Criterion | Weight | Score | Best evidence | Points |
|---|---|---|---|---|
| Verified evidence | 20 | 6/10 | Grade A | 12.0 |
| Risk and drawdown behaviour | 20 | 3/10 | Grade A | 6.0 |
| Profitability quality | 15 | 5/10 | Grade A | 7.5 |
| Sustainability | 15 | 5/10 | Grade B | 7.5 |
| Transparency and trust | 10 | 5/10 | Grade B | 5.0 |
| Practical fit | 10 | 4/10 | Grade B | 4.0 |
| Cost and value | 5 | 3/10 | Grade B | 1.5 |
| Support and usability | 5 | 6/10 | Grade B | 3.0 |
| Total | 100 | 46.5 |
What Waka Waka actually is
Waka Waka EA MT5 is an Expert Advisor for MetaTrader 5, sold on the MQL5 Market by Valeriia Mishchenko of Russia, whose seller profile shows a 4.2 rating from 277 votes, 14 products and 11 signals, with a website at valerytrading.com. It trades three pairs, AUDCAD, AUDNZD and NZDCAD, from a single 15-minute chart, and was published on 19 August 2021. The Market showed version 4.59, updated on 8 February 2026. A separate MT4 version (product 66317) exists.
The listing calls it an 'advanced grid system' designed to exploit market inefficiencies instead of being fitted to history. Entries use Bollinger Bands and an RSI cap to filter low-potential trades. After the first trade, if price moves against it, the EA adds more positions at set distances, with separate lot multipliers for the second trade, the third to fifth, and the sixth onward. The page never uses the word 'martingale'. It does describe lot multipliers on losing positions, which is the mechanism that word names, and we use it where it fits.
| Item | What the vendor says |
|---|---|
| Seller | Valeriia Mishchenko, Russia. Seller rating 4.2 from 277 votes; 14 products, 11 signals. |
| Price | $2,800, purchase only, with a free demo. No rental option. 10 activations. |
| Strategy | AUDCAD, AUDNZD and NZDCAD on M15 from one chart. Bollinger Bands and RSI entry filter; a grid with distance, 'smart distance' and multipliers for trades 2, 3 to 5 and 6 onward. |
| Risk controls | Maximum drawdown percent input that closes positions; grid stop loss (1000 pips if left at zero); maximum lot, spread and slippage; news filter; holiday filter; deposit-load and four risk presets. |
| Requirements | Hedging account, a VPS, access to a news list and time server. At 1:30 leverage, low-risk settings only on accounts under $6,000. At 1:100, up to 'significant' risk on $1,000. |
| Track record | '8+ years of live track record with +12,000% account growth', linked to signal 995287. |
| Reach | 23,651 free demo downloads, rating 4.13 from 44 reviews, 164 comments. |
| Versions | 4.59, updated 8 Feb 2026. The 'What's new' content was not readable. |
How we judged it, and who has something to sell
Evidence on EAs is never neutral. Here is every party near this product and what each stands to gain, ours included.
- The developer sells the EA, sells signal subscriptions (999 USD a month, currently not permitted on this one) and runs the live accounts. Her record is public, which counts for something, and it is also her sales page.
- MQL5 and MetaQuotes host the Market, the reviews and the signals. The signal statistics and every warning on its page are the platform's own.
- Buyers who wrote reviews include satisfied users and several who report heavy losses. Testimony, not data, and each is unverifiable from outside.
- ForexCopilotEA sells a listing for this EA. We gain if you buy it, which is why this verdict opens with that fact and applies the same rules as every other.
Evidence ladder: what each rung of proof held for Waka Waka
Grade A: Independent proof
- MQL5 signal 995287, 'Waka Waka EA', at ICEMarkets-Server (MT4): platform-built statistics for 436 weeks and 5,515 trades. The vendor runs the account, so her interest is noted, but the figures are computed from broker history and the platform's warnings are its own.
- MetaQuotes and Myfxbook documentation, used for how testing reports and verified records work.
Grade B: Checkable vendor material
- The Market listing: version, price, inputs, requirements, dated reviews and developer replies.
- The free demo, which runs in the Strategy Tester only, a setup video and a setup guide.
Grade C: Claim only
- '8+ years of live track record with +12,000% account growth' and '60 months in profit': headline figures without a record we could open that matches them.
- Buyer claims on both sides: 'drawdown over 70% and the author added 30% capital', 'my account was wiped out' and 'safe, stable profit for six months'.
Grade D: Conflicted or anonymous
- Reseller pages that sell the EA as a download for a few dollars or promise it 'free'. Nothing on them is used as proof.
The live signal: what 436 weeks and 5,515 trades show
The signal is MT4 account 995287 at IC Markets, 1:300 leverage, monitored by MQL5 since 6 May 2021 and labelled 'growth since 2018' by the author. It starts from 500 USD, took 3,000 USD of deposits and paid out 4,352.41 USD, so its curve is shaped by cash moving in and out. On 21 October it showed a balance of 15,902.70 USD, an equity of 10,739.08 USD, and growth of 383.99%.
| Measure | Value | What it means |
|---|---|---|
| Age | 436 weeks, monitored from 6 May 2021 | The only record in our verdict set longer than a few months. The page's week count, its start date and the 'since 2018' label do not agree, so the earliest history is unclear. |
| Trades | 5,515 (4,083 winners, 1,432 losers) | A large sample, about 6 a week, average hold about a day. |
| Win rate | 74.03% | High, as a grid's win rate usually is. |
| Average win / loss | +9.99 USD / -16.79 USD | Payoff ratio of 0.6: each loser costs 1.7 winners. |
| Profit factor | 1.70 | Gross profit 40,799.82 USD against gross loss 24,044.71 USD. |
| Worst / best trade | -541.76 USD / +1,499.62 USD | The worst loss is 54 times the average win. |
| Drawdown by balance | 12.58% (1,821.22 USD); 13.88% relative | Measured on closed trades. |
| Drawdown by equity | 72.42% relative (5,337.38 USD) | Measured including open baskets. The number that shows what a grid can look like. |
| Deposit load | 72.13% maximum | Margin use peaked above 72%. |
| Cash flow | 500 start, +3,000 deposits, -4,352.41 withdrawals | Growth of 384% is measured on a base that changed. |
| Monthly growth | 0.14% (page forecast 1.73% a year) | The platform's own forecast is far smaller than the headline. |
- Maximum drawdown by balance12.6%
- Relative drawdown by balance13.9%
- High current drawdown flagged on 20 Oct 202630%
- Relative drawdown by equity72.4%
The notice on the signal's own page
Two notices sit at the top of the signal. The first says subscription is not permitted: 'Current drawdown is dangerous for subscribers. Subscription will be allowed once drawdown improves.' The second says 'Trading style has changed. Trading history before the start of monitoring is not included in statistics.' Below them, MQL5's warning history shows 'High current drawdown in 30%' on 20 October, 31% on 19 October, 33% on 18 October and 32% on 15 October, each cleared and raised again within hours, and the same pattern on 30 September and 1 October. The wording of the warning, per MQL5, is that 'high current drawdown indicates the absence of risk limitation'.
We make no allegation from this. A grid is expected to run into baskets that are under water for weeks, and the drawdown may recover. What it does tell a buyer is that on the day we checked, the vendor's own public account was 30% under water on an equity basis, that its balance of 15,902.70 USD was 5,163.62 USD above its equity, and that MQL5 itself thought the drawdown dangerous enough to bar new subscribers.
Where does '+12,000%' come from?
The listing's headline is '8+ years of live track record with +12,000% account growth'. The platform shows 383.99%, with a base that changed through deposits and withdrawals, and a monthly growth figure of 0.14%. The +12,000% may come from another account, a different start date or a compounding calculation, and the listing links only this signal. Until a record matching it can be opened we grade the figure C: reported, never scored as proof. Our guide on verifying an EA's track record shows what to ask for.
A note on the figures. MQL5 pages are generated from the account, but one page can show the same measure two ways: this signal's lower sections list different streak figures from its main table, and it prints several drawdowns. We quote the main statistics block and name the basis, and where the page disagrees with itself we say so.
A grid with multipliers: what that means for risk
Waka Waka's rule is simple to state. It opens a first trade. If price moves against it by a set distance, it adds a second, larger trade. If price keeps going, it adds a third, fourth and fifth with a larger multiplier, then more beyond six. The whole basket closes when it reaches a weighted take profit, or when the grid stop (1,000 pips if left at zero) or the maximum-drawdown input fires. A high win rate follows from the structure: most baskets close in profit because price tends to come back. The cost is in the few baskets that do not.
That shape is visible on the signal. A 74% win rate and a profit factor of 1.70 are what a grid produces in good periods. A worst trade of 541.76 USD against an average win of 9.99 USD, an equity drawdown of 72% and a margin load that peaked above 72% are what it produces when a basket goes deep. Both belong to the same account, and a buyer should assume both will recur. Our grid, martingale and scalper comparison sets out the mechanics.
Three of the listing's own statements matter here. The first is the leverage guidance: at 1:30, the developer advises low-risk settings only on accounts under $6,000, which is a plain statement that a small account on European retail leverage cannot run this at higher risk. The second is that at 1:100 'up to significant risk' is said to be fine on a $1,000 account, which sits oddly beside a 72% equity drawdown on the vendor's own signal. The third is the default grid stop of 1,000 pips, which is very wide on AUDCAD or NZDCAD, where a thousand pips is a move of 10 cents. Treat the maximum drawdown percent as the real stop, and set it yourself.
What buyers say, and what reviews cannot tell you
The listing shows a 4.13 rating from 44 reviews and 164 comments. We could read 20 reviews, dated from 2022 to 2025. The pattern is the pattern of any long-running grid: positive reviews cluster in calm stretches and negative ones follow trending months.
- The positive ones. Buyers praise support, customisation, an ECN broker and low-risk settings; one reports 265% over about a year on aggressive custom settings with a Sharpe below one and a profit factor above two, and notes support can be slow. Several are short, with no detail.
- The wipe-out reports. A buyer on 1 May 2024 advises against it, claiming a drawdown above 70% and that the developer added 30% capital to her account; the developer replies that users should apply appropriate risk management, points to a medium-risk 'Smart TP' signal and says risk is set in money, not percent. A buyer on 31 March 2024 warns of grid plus martingale-style doubling and a lost account; the developer disputes it and cites third-party-verified records. A buyer on 12 June 2023 says the martingale grid can blow accounts when a trend persists; the developer replies that built-in parameters prevent loss, cites 60 months of profit and says public balances total about $23,000.
- The June 2023 episode. One reviewer says that in June 2023 high and significant-risk accounts were 'washed out' on AUDCAD and a low-risk account ran a 52% drawdown. Another notes NZDCAD trend losses in late May for many users. Both are unverified, and both describe the same weak spot.
- The low-risk view. A reviewer who ran a 0.25% deposit-load setting reports about a 20% drawdown and about 8.1% a year, and alleges that the Telegram admin threatens members who post negatively. We cannot verify either claim, and we report the second as an allegation with no reply on record.
The developer's replies are consistent and specific in one respect: they ask the user to set risk in money, to use the built-in controls and to compare with the public records. They do not give the deepest basket in the history, and they do not say whether the 30% current drawdown has a parallel in the past. Our guide on what to do when an EA is in drawdown covers the decisions a buyer should make before that day, not during it.
The real price of Waka Waka
$2,800 is among the highest licence prices on the Market, and it is offered as a one-off with no rental. Against that, there is a free demo with 23,651 downloads, which runs in the Strategy Tester only. The price is large in absolute terms and small next to the capital a grid needs to survive its drawdown: at the vendor's own guidance, a buyer needs several thousand dollars on top of the licence. A buyer on a ten-times-cheaper listing should still read the signal as the strategy's, not the seller's.
| Cost | Typical figure | Note |
|---|---|---|
| Licence | $2,800 listed | One-off, no rental. Ours is a separate sale at its own price. |
| VPS | $10 to $30 a month | Required: the EA must run continuously. See our VPS setup guide. |
| Capital | $1,000 at 1:100, $6,000+ at 1:30 | Per the vendor's own leverage guidance; a deep basket can need far more. |
| Broker | Hedging ECN account | Spread and slippage matter less than for a scalper, but swaps on multi-day baskets are a real cost. |
| Your time | 12 weeks of demo | The test plan below. |
Can your account actually run it?
The setup is detailed and honest about its demands: a hedging account, a VPS, the three currency pairs on one M15 chart, access to a news list and a time server, and the right broker suffix in the symbol list. The leverage guidance is the most important sentence on the page. Under ESMA rules European retail accounts are capped at 30:1 on major pairs, which is where the $6,000 low-risk threshold comes from. See our ESMA guide and our hedging versus netting guide.
Sizing is where buyers are most often hurt. A deposit load of 1% or less is what one experienced reviewer recommends. The signal's own maximum deposit load of 72% is a reminder that margin use is a choice and a risk. Set the maximum-drawdown input yourself, test it in the tester and plan on being under water for weeks. See how much money to run an EA and our lot sizing guide. On prop firms, a grid that can add several positions on a losing basket is usually a poor fit for a firm's daily-loss limit; see our FTMO guide.
Will it last?
Sustainability asks whether an edge survives a different market. Waka Waka has the best claim to an answer among the products we have scored: it has been on sale since 2021, its signal has run for years and the listing was updated in February 2026. Against that stands the nature of a grid, which earns small amounts steadily and gives some back in trends, the 'trading style has changed' notice on the signal, and reviewers who report accounts wiped out on a single AUDCAD or NZDCAD trend. The pairs the EA trades are among the most range-bound in the market, which suits a grid until it does not. The ongoing 30% drawdown is a live test of that, and its outcome will say more than any review.
What we could not see
Criterion by criterion: how the 46.5 was built
Each score below is out of 10, multiplied by the criterion's weight, and sits inside the tier described by the written scoring anchors. The reasoning is short on purpose; the sections above carry the evidence.
| Criterion | Score | Points | Why |
|---|---|---|---|
| Verified evidence (weight 20) | 6 / 10 | 12.0 | A platform-built signal of 436 weeks and 5,515 trades is real evidence. Material gaps keep it at 6: it is the MT4 account, style and history changed, cash flows shape the curve and the vendor runs it. |
| Risk and drawdown behaviour (weight 20) | 3 / 10 | 6.0 | A grid with multipliers cannot score above the 3 to 4.5 tier. The signal's equity drawdown is 72%, the platform warns of dangerous drawdown and subscription is barred. Label High. |
| Profitability quality (weight 15) | 5 / 10 | 7.5 | A verified profit factor of 1.70 and positive expectancy across 5,515 trades, offset by a payoff of 0.6, a platform forecast of 0.14% a month and equity far below balance today. |
| Sustainability (weight 15) | 5 / 10 | 7.5 | Five years of history and a vendor with staying power, offset by a regime-dependent grid, a style-change notice and reports of wipe-outs in the June 2023 trend. |
| Transparency and trust (weight 10) | 5 / 10 | 5.0 | A detailed public input list, a setup guide and specific replies, offset by a headline figure with no record behind it, careful wording around martingale and an unresolved moderation allegation. |
| Practical fit (weight 10) | 4 / 10 | 4.0 | Hedging, a VPS, three pairs and a news feed; the leverage guidance means $6,000 or more at 1:30 and 'significant' risk at $1,000 under 1:100. |
| Cost and value (weight 5) | 3 / 10 | 1.5 | $2,800 with no rental against a record that today shows a large floating loss; the free demo is the mitigation. |
| Support and usability (weight 5) | 6 / 10 | 3.0 | Free demo, setup video, guide and a public input list, with replies within a day; some buyers say support can be slow. |
Who it might suit, and who should walk away
- It might suit an experienced trader with several thousand dollars of risk capital, a hedging ECN account and a VPS, who understands grid mechanics and will set the maximum-drawdown input before the first trade.
- It might suit someone who values a vendor with a years-long public record and is willing to plan around the drawdown instead of hoping it will not come.
- Walk away if you are buying because of '+12,000%'. The platform shows +384% and a 0.14% monthly growth figure.
- Walk away if your account is under $1,000, or under $6,000 on 1:30 leverage and you want more than the lowest risk setting.
- Walk away if you cannot sit through a 30% to 70% equity drawdown, or cannot afford to lose the account.
If you want to test it: a 12-week plan
Step 1: Weeks 1 to 2: read the signal
Open signal 995287 and note the equity drawdown, the current warning and the cash flows. Note the trading-style notice.
Step 2: Weeks 2 to 4: run the demo in the tester over the stress years
Use real ticks over 2020 to 2025 on AUDCAD, NZDCAD and AUDNZD, including the June 2023 trend. Record the deepest equity drawdown at each risk preset.
Step 3: Weeks 4 to 10: forward-test on a demo
Same version, same broker, lowest risk preset and the maximum-drawdown input set. Record every basket's depth.
Step 4: Weeks 10 to 12: decide with numbers
Continue only if the deepest basket in your tests is one your account survives at the size you would use, with margin to spare.
Step 5: Start small, and only if it passed
Fund an amount you can lose completely and treat the first live month as part of the test.
Ten questions to put to the developer before you pay
A developer with a real edge can answer these in a paragraph. Vague or missing answers are information too, and they are the fastest way to close the gaps this verdict could not.
- Which account and period produce the '+12,000%' headline, and can it be opened on MQL5 or Myfxbook?
- What changed when MQL5 noted that trading style had changed, and which version has the signal been running since?
- What is the deepest basket in the signal's history, in positions, lots and equity drawdown, and when was it?
- What are the default multipliers for trades 2, 3 to 5 and 6 onward, and the default maximum-drawdown setting?
- Why is the default grid stop 1,000 pips, and what does the signal use?
- How is the signal's current 30% drawdown being managed, and when do you expect subscription to reopen?
- How do you answer the reviews that describe doubling, a developer-funded account and Telegram moderation?
- Is there an MT5 live signal for the exact version I would buy?
- What is the refund policy, and what happens to a buyer whose account is stopped out?
- What does a $1,000 account on 1:100 leverage look like at 'significant' risk in the worst week of the backtest?
What would move this score
- An MT5 signal on the current version, of at least 12 months, at the default and the low-risk presets, with the monthly table visible. This lifts evidence.
- A published deepest-basket history and a stress test of each risk preset. This lifts risk, though a grid will not leave the High label.
- The record behind '+12,000%'. This lifts trust and evidence together.
- A resolution of the current drawdown and a reopened subscription. This lifts risk and profitability.
- Downward risks: a deeper drawdown, a style change that breaks the history again, or further wipe-out reports.
The developer, or any reader with the signal open, can send corrections through the contact page. We will recalculate and log the change with the date at the top of this page.
How it compares with the other verdicts
Next to Quantum Queen X at 36.5 and Wave Rider at 43.0, the other grids we have scored, Waka Waka has far more proof than either, and the proof contains a deeper drawdown. Next to Quantum Titan, which scored 51.0 on a 32-week signal, its 46.5 reflects a longer, more mixed record. Its sister product Perceptrader AI adds an AI filter to a similar pair set. For how these system types differ, see our strategy comparison and our grid category.
Sources and when they were opened
- MQL5 Market: Waka Waka EA MT5 (product 70283), opened 21 October 2026Source of the price, version, inputs, requirements, rating, 20 of 44 reviews and the developer's replies. Written by the vendor and by buyers.
- MQL5 Signals: Waka Waka EA (signal 995287, MT4), opened 21 October 2026Source of every performance figure, notice and drawdown warning in this verdict. The vendor operates the account.
- MQL5 Market: seller page for Valeriia Mishchenko, opened 21 October 2026Source of the seller rating, product list and signal list.
- Myfxbook Help: VerificationHow a trading account's track record is verified on Myfxbook.
- MetaTrader 5 Help: Testing ReportWhat each figure in the tester's report means, including drawdown.
- MetaTrader 5 Help: Strategy TestingThe Strategy Tester: testing modes, settings and forward testing.
- ESMA: ESMA agrees to prohibit binary options and restrict CFDs to protect retail investorsThe EU leverage limits, margin close-out, negative balance protection and risk-warning rules for retail CFD accounts.
- CFTC Customer Advisory: AI Won't Turn Trading Bots into Money MachinesA US regulator's warning about trading-bot claims of unusually high returns.
Frequently asked questions
Is Waka Waka EA legit?
It is a real, long-running product with a documented design, a public signal with 436 weeks of history, regular updates and a developer who replies to reviews, rated 4.13 from 44 reviews on the MQL5 Market. We do not allege wrongdoing. Its record includes a 72% equity drawdown and a current warning, which is why it scores 46.5 out of 100 with a High risk label.
Does Waka Waka use a grid or martingale?
It is a grid. The listing describes lot multipliers for the second trade, the third to fifth and the sixth onward, added as price moves against the first position, and a basket that closes at a weighted take profit. The page avoids the word martingale, and increasing lot size on losing positions is the mechanism that word describes.
What drawdown does Waka Waka have?
On the vendor's signal the maximum drawdown was 12.6% by balance and 72.4% relative by equity, and on 20 October 2026 MQL5 flagged a current drawdown of 30%. The signal page also says subscription is not permitted because the current drawdown is dangerous for subscribers. Plan around the equity figure, not the balance one.
How much does Waka Waka cost?
The MQL5 Market price on 21 October 2026 was $2,800 with no rental. A VPS and a hedging ECN account are extra, and the vendor advises low-risk settings only on accounts under $6,000 at 1:30 leverage. A free demo is available and runs in the Strategy Tester. Sellers differ in price, version and terms, so read the terms of whichever seller you use.
What is the minimum deposit for Waka Waka?
No minimum is stated. The listing gives examples: at 1:30 leverage, low-risk settings only on accounts under $6,000, and at 1:100, up to significant risk on a $1,000 account. Treat $1,000 as a floor for the lowest risk setting, and remember that the vendor's own signal reached a 72% equity drawdown.
Is the +12,000% growth claim real?
We could not verify it. The listing links one signal, and MQL5 shows +384% on it, on a base that changed through deposits and withdrawals, with a platform forecast of 0.14% a month. The +12,000% may come from another account or period. Ask the developer for the record behind it.
How was the score calculated?
Eight weighted criteria (evidence 20, risk 20, profitability 15, sustainability 15, trust 10, fit 10, cost 5, support 5), each scored out of ten against written anchors. Sources are graded A to D and unverified claims cannot count as proof. We sell a listing for this EA, which is disclosed at the top, and a grid cannot be rated better than High risk. The total here is 46.5 out of 100.
Gold Expert Advisors in our store
We sell these, so weigh that interest. Put the same eight questions to any of them before you buy: read the manual, run your own backtest, and start on demo.



Keep reading
- EA Verdict #1Quantum Queen X Review: Verdict and Risk (2026)Is Quantum Queen X worth $1,199.99? Independent EA verdict: 36.5/100, High risk. Evidence, drawdown, trust and cost scored from sources opened 17 Oct 2026.
- EA Verdict #5Wave Rider EA Review: Verdict and Risk (2026)Is Wave Rider EA worth $249? Independent EA verdict: 43.0/100, High risk. Grid recovery, a three-week signal, reviews and cost scored, 17 Oct 2026.
- Risk managementEA in Drawdown: What to Do (and What Not to Do)What to do when your Expert Advisor is in drawdown: separate normal from broken, check the logs, compare with the backtest, and decide to hold, reduce or stop.
- Strategy comparisonWhich EA Strategy Wins Long Term?Compare MT5 Expert Advisor strategy types, from scalping and grid to hedging and arbitrage: how each earns, how each fails, and which tend to survive long term.