
EA Verdict #6
Dynamic Liquidity Intelligence Review (2026): +86% in 30 Weeks, an 85% Win Rate and a Thin Cushion
By Benjamin Lee · Updated · 27 min read
Dynamic Liquidity Intelligence is a gold breakout EA that places Buy Stop and Sell Stop orders at swing highs and lows, puts a stop loss and take profit on every trade, and says it uses no grid, no martingale and no averaging. Unlike most gold EAs, it comes with a live MQL5 signal that anyone can open: 247 trades over 30 weeks, +85.98% on a $10,000 account, an 85.4% win rate and a maximum drawdown of 11.63%. We scored it on the same eight criteria as every verdict here. The result is 48.5 out of 100 and a Medium risk label: a clean, bounded-risk record with a thin edge, a rising price and a vendor who has 26 products to look after.
Key takeaways
- Dynamic Liquidity Intelligence scores 48.5 out of 100 (band: Weak) with a Medium risk label. A 30-week, 247-trade signal built by MQL5 from broker history is real evidence, but it is vendor-run, under 12 months, and the profit factor is 1.49.
- The signal shows +85.98% on $10,000, 247 trades, 211 winners (85.42%), a worst trade of -$597.60 and a balance drawdown of 11.63%. The average win is $123.14 and the average loss $482.93, a payoff of 0.26, so the break-even win rate is 79.7%. The cushion is 5.7 points.
- Our arithmetic puts the low end of a 95% interval on the win rate at about 80.5%, only 0.8 points above break-even, and the profit factor near 1.35 if the longest winning streak is removed. The edge is real in the sample and thin in the margin.
- The vendor's own risk guidance runs from 0.01 lot per $1,000 (conservative) to 0.01 per $300 (aggressive). If the signal is at the conservative end, as its name suggests, scaling its drawdown to the aggressive setting gives roughly 39%. Which setting you pick matters more than the EA.
- We sell a listing called Dynamic Liquidity Intelligence (v2.27 in our store, the same version number as the Market), so this is a review of a product we sell. It was scored by the published method, and the disclosure comes first.
- 48.5 / 100
- weighted verdict score on eight published criteria
- +85.98%
- gain on the vendor's live MQL5 signal over 30 weeks and 247 trades, with an 11.63% balance drawdown
- 0.26
- payoff: the average win is about a quarter of the average loss, so the 85% win rate carries the whole result
The verdict at a glance: a bounded design, a long enough signal and a thin cushion
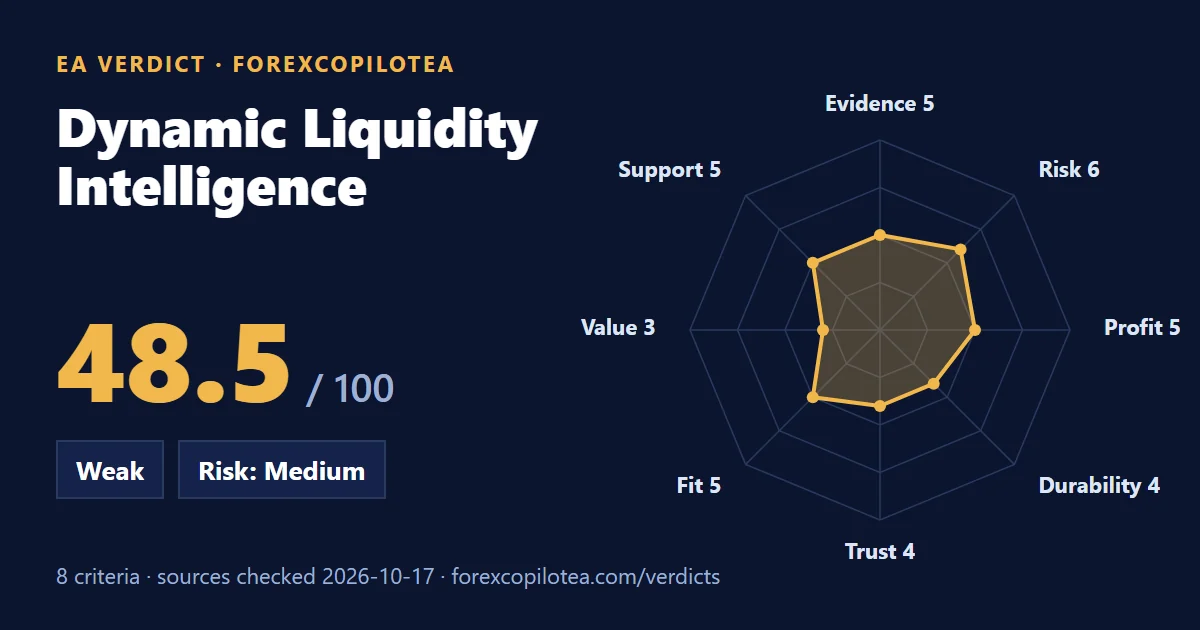
This is a product that does the basics right. It has a stop on every trade by the vendor's description, a public live signal that is long enough to mean something, a drawdown that looks modest, and risk guidance that is stated by the vendor. It loses points for what is common to fast, high-win-rate breakout systems: a payoff well below one, a margin over break-even of a few points, a vendor-run record under a year, a price that climbs with every ten sales and review replies that read like a template. The table and radar show how the 48.5 was built.
48.5 / 100
Weighted verdict score
Weak
Verdict band
Medium
Risk label
| Criterion | Weight | Score | Best evidence | Points |
|---|---|---|---|---|
| Verified evidence | 20 | 5/10 | Grade A | 10.0 |
| Risk and drawdown behaviour | 20 | 6/10 | Grade A | 12.0 |
| Profitability quality | 15 | 5/10 | Grade A | 7.5 |
| Sustainability | 15 | 4/10 | Grade C | 6.0 |
| Transparency and trust | 10 | 4/10 | Grade B | 4.0 |
| Practical fit | 10 | 5/10 | Grade B | 5.0 |
| Cost and value | 5 | 3/10 | Grade B | 1.5 |
| Support and usability | 5 | 5/10 | Grade B | 2.5 |
| Total | 100 | 48.5 |
What Dynamic Liquidity Intelligence actually is
Dynamic Liquidity Intelligence is an Expert Advisor for MetaTrader 5 that trades gold (XAUUSD) on the M15 chart. It is sold on the MQL5 Market by Sathit Sukhirun of Thailand, whose seller profile shows a 4.4 rating from 19 votes, 26 products and 26 signals. It was published on 23 March 2026 and showed version 2.27, updated on 17 July 2026.
The listing describes a market-structure breakout system. It 'calculates recent highs and lows based on market volatility to place Buy Stop and Sell Stop orders at potential breakout levels', manages each position individually, and 'does not utilize Grid, Martingale, or position averaging strategies. Every order is executed with a strictly predefined Stop Loss and Take Profit.' Take profit and stop loss adjust to volatility within a defined ratio, with an automatic break-even and a step-by-step trailing stop. It can pause before the weekend, over the New Year period and outside chosen sessions.
| Item | What the listing says |
|---|---|
| Seller | Sathit Sukhirun, Thailand. Seller rating 4.4 from 19 votes; 26 products and 26 signals. |
| Price | $550. 'Only 1 copies remain available at $550. The price will increase by $50 after every 10 purchases.' No rental. 20 activations. |
| Strategy | XAUUSD, M15. Buy Stop and Sell Stop orders at volatility-derived swing highs and lows. Predefined stop loss and take profit on every trade, break-even, step trailing stop. No grid, martingale or averaging. |
| Risk guidance | Conservative: 0.01 lot per $1,000 of balance. Moderate: 0.01 per $500. Aggressive: 0.01 per $300. |
| Requirements | Hedging account, ECN, RAW or Razor spreads. Minimum deposit $300; $500 to $1,000 recommended. Leverage 1:100 minimum, 1:500 recommended. VPS recommended. |
| Filters | Friday filter before the weekend close, a New Year holiday pause, and trading-session filters. |
| Live monitoring | Four live signals: fixed 0.01 lot, and $2,000, $5,000 and $10,000 accounts sized at 300, 500 and 1,000 per 0.01 lot. |
| Reach | 1,300 free demo downloads, 24 purchases a month, rating 4.44 from 17 reviews. |
How we judged it, and who has something to sell
Evidence on EAs is never neutral. Here is every party near this product and its stake, ours included.
- The vendor sells the EA, sells signal subscriptions (350 USD a month for the signal read here) and runs the live accounts. The record is public and generated by the platform from broker trades, but the person running it is also the person selling the licence.
- MQL5 and MetaQuotes host the signal and the Market. The statistics are computed by the platform, and its warnings are its own.
- Buyers who wrote reviews are mostly short-term users, and the vendor's replies are near-identical. Testimony, not data.
- ForexCopilotEA sells a listing under this name. We gain if you buy it, which is why this verdict opens with that fact and applies the same rules as every other.
Evidence ladder: what each rung of proof held for Dynamic Liquidity Intelligence
Grade A: Independent proof
- MQL5 signal 2365511, 'Dynamic Liquidity Intelligence R1000', at Just2Trade-MT5: platform-built statistics for 30 weeks and 247 trades. The vendor operates it, so we weigh it below a fully independent account.
- MetaQuotes and Myfxbook documentation, used for how testing reports and verified records work.
Grade B: Checkable vendor material
- The Market listing: version, price, requirements, risk guidance, dated reviews and developer replies.
- The free demo, which a buyer can run.
Grade C: Claim only
- 'No grid, no martingale, no averaging' and the 'strictly predefined stop loss': sales claims. The signal's loss sizes are consistent with a stop on every trade but do not prove it for every setting.
- Review claims of results with no account behind them.
Grade D: Conflicted or anonymous
- Pages that offer the EA for free or by 'original licence key', and any review we cannot identify. None of it is used as proof.
Under the written anchors, a verified record under 12 months sits in the 5 to 6.5 tier on evidence, and we take the lower end because the vendor runs the signal and the version match is unknown. A 12-month signal on the current version with a visible monthly table would lift it.
The live signal: what the record shows
The signal is MQL5 signal 2365511, named 'Dynamic Liquidity Intelligence R1000', at Just2Trade-MT5, funded with $10,000 and trading XAUUSD only. The listing also links three more signals at other account sizes (signal numbers 2365513, 2365514 and 2370969); we read this one. The page prints 30 weeks and a start of 23 March 2026, the same day the product was published. We read every figure on 17 October 2026, and several are linked by simple arithmetic that we checked: gross profit of $25,983.13 over 211 winners gives the $123.14 average win, and gross loss of $17,385.30 over 36 losers gives the $482.93 average loss.
| Measure | Value | What it tells you |
|---|---|---|
| Growth and profit | +85.98%; profit $8,597.83 on $10,000; equity and balance $18,597.83 | Positive and substantial after 30 weeks. No deposits or withdrawals, so growth is not distorted by cash flows. |
| Trades | 247 (112 long, 135 short); 211 winners (85.42%), 36 losers | A reasonable sample for a 30-week record, and both directions were used. |
| Profit factor | 1.49 (gross profit $25,983.13; gross loss $17,385.30) | A genuine but modest edge. Gross profit is 49% above gross loss. |
| Average win and loss | +$123.14 against -$482.93 | The average loss is 3.9 times the average win: a payoff of 0.26. |
| Best and worst trade | +$554.76 and -$597.60 | The worst loss is only about 24% larger than the average loss, which is what a fixed stop looks like. |
| Streaks | 26 consecutive wins worth $2,550.89; at most 2 consecutive losses, -$1,176.84 | The best winning run is about 30% of the profit. Two losses in a row cost 11.8% of the deposit. |
| Drawdown | Balance drawdown $1,822.51 (11.63%); MQL5 also prints an equity figure of 3.42% ($360.58); max deposit load 2.62% | Moderate against the gain. The equity figure is smaller than the balance figure, which is unusual, so we plan around the larger one. |
| Recovery factor and Sharpe | 4.72 and 0.17 (MQL5's own calculations) | Recovery factor is profit divided by balance drawdown. We lean on neither. |
| Activity | Average hold 2 hours; 119 trading days (58.05%); about 8 trades a week | Active enough to give a pattern, and short enough to be sensitive to execution. |
| Copy economics | Signal price 350 USD a month; 0 subscribers; slippage 'No data' | Nobody has paid to copy it, so nothing is known about how it copies. |
Two readings of one record. The first: a real-money account that has grown 86% in 30 weeks with a drawdown of 11.63%, longs and shorts used, a worst loss of $597.60 and no more than two losses in a row. The second: a profit factor of 1.49 is thin for a system that loses almost four times what it wins, 30 weeks is under a year, and the record belongs to the seller. Both are true, and a sales page quotes the first.
The platform's own warning log adds a caution. It raised 'share of days for 80% of growth is too low' early in the signal's life (for example, '80% of growth achieved within 1 days' of the first 30), and the current list still shows 'share of trading days is too low' and 'share of days for 80% of trades is too low'. Those are normal for a breakout system that trades in bursts. They also say that a short record can be lumpy, and that a percentage gain is not a smooth rate.
85% wins and a payoff of 0.26: what the maths says
Divide the average win by the average loss and you get the payoff: $123.14 over $482.93 is about 0.26. The system wins 85 times in 100 and each loss takes back almost four wins. A strategy with that payoff needs a win rate of 1 divided by 1.26, which is 79.7%, just to break even. The signal's 85.42% clears it by 5.7 percentage points. That cushion is the entire edge, so the question is how safe it is.
A 247-trade sample carries a margin of error. Treating each trade as a coin flip with a true win rate p, a 95% interval around the observed 85.4% runs from roughly 80.5% to 89.3%. The low end is only 0.8 points above the 79.7% break-even line. In plain terms the data are consistent with a positive edge, and also with an edge close to zero. A longer record, or a payoff that improves, would settle it.
- Break-even win rate at a payoff of 0.2679.7%
1 divided by (1 + 123.14/482.93). Below this the system loses money.
- Low end of a 95% interval on the observed rateabout 80.5%
Our estimate for 211 wins in 247 trades.
- Observed win rate on the signal85.42%
211 wins, 36 losses, read 17 October 2026.
Use the calculator below to see how little room a low-payoff system has. Enter a win rate near 85% and an average win about a quarter of the average loss and expectancy is positive; drop the win rate to 80% and it falls to roughly zero.
Interactive: win rate is not edge
- Expected result per trade
- +0.35
- Profit factor
- 1.64
- Break-even win rate
- 33%
At these numbers the system has a positive edge before costs. Add spread, commission and slippage per trade and re-check.
In money terms the signal earned $34.81 a trade, about 0.35% of the starting deposit. That is comfortable at this size, and it is also the margin a wider spread, a slipped fill or a different broker eats into first. Pending breakout orders are especially exposed to this: a Buy Stop fills at the next available price, which in a fast gold move can be worse than the order price.
How much of the profit is one winning run?
The signal lists its longest winning run as 26 trades worth $2,550.89. Read as one unbroken run, that is about 30% of the $8,597.83 profit. That is far less concentrated than the profile of some fast gold systems, where one streak supplies most of the result, and we count it in the signal's favour.
As a stress test, strip the run out. The other 221 trades, including all 36 losers, made $6,046.94. Gross profit falls to $23,432.24 against the same $17,385.30 of losses, so the profit factor is about 1.35. The win rate on those trades is 83.7% (185 of 221) and the average win is about $126.66, which puts break-even at 79.2%, so the cushion is about 4.5 points. These are our figures from the signal's own numbers, and removing a best run is deliberately harsh. They show that the edge survives without it, but narrowly.
Drawdown: what the signal did, and what your setting could do
The signal's worst balance drawdown is $1,822.51, or 11.63% from its peak balance. For a system that holds trades for two hours, that is moderate. Look at how it is built. The average loss is 4.83% of the starting deposit and the worst is 5.98%, so the largest drawdown on record is about 3.8 average losses, and the two consecutive losses the signal has had cost $1,176.84, 11.8% of the deposit.
- Average losing trade (-$482.93)4.83%
36 losers in 247 trades.
- Worst losing trade (-$597.60)5.98%
About 24% larger than the average loss.
- Two consecutive losses (-$1,176.84)11.77%
The longest losing run so far.
- Maximum balance drawdown ($1,822.51)18.23% of the deposit
11.63% of the peak balance, which had grown by then.
The loss distribution is consistent with a fixed stop on every trade, because no loss is larger than about 1.24 times the average, which is what the vendor says the EA does. We call it consistent, not proven: we have not seen the trade list or the code.
Interactive: drawdown recovery
Gain needed to get back to break-even
+42.9%
Blue: equity left. Red: equity lost.
Consecutive losing trades to reach this drawdown: 36
A drawdown of 11.63% needs a gain of about 13.2% to recover. The calculator shows how quickly that arithmetic turns against a trader as the drawdown grows. Our guides to drawdown and lot size and risk cover how to size against the number you measure.
How a pending-order breakout system makes money, and how it loses it
A breakout system waits for price to leave a range and joins the move. This one places Buy Stop and Sell Stop orders just beyond recent swing highs and lows, so it is in the market only if price actually breaks the level, and it carries a stop and a target. The picture below shows the structural weakness of the family.
Three structural facts follow. False breaks cost a stop each, which is why the payoff is below one: the system takes many small winners and fewer, larger losses. Execution is the product. A pending order that fills at a worse price in a news spike turns a planned loss into a larger one, so spread, slippage and VPS latency matter. Gaps and rollover are hazards. The vendor includes a Friday filter and a holiday pause, which are sensible, and they cannot remove the risk of a gap between stop and fill. Our guides to spread and slippage and scalping EAs explain each cost.
What buyers say, and what reviews cannot tell you
The listing shows 4.44 from 17 reviews. The ones we read, from April to September 2026, are mostly short and positive: 'high win rate, smooth performance, easy to use', 'good EA and stable results', 'works well in normal market conditions' and 'the most reliable EA I've tried'. Several reviewers gave a star rating with no comment. One reviewer gave 4 stars, saying there is room for improvement from the author.
One review is critical. On 10 April a reviewer wrote that one trade lost 10% while the wins were about 0.2%, and called the EA a 'noob' EA. The developer replied two months later, on 14 June, explaining that a 10% loss needs a 2 to 4% gain to recover and that the EA aims for a win rate above 80% to make that quick. We cannot verify the reviewer's account. It is consistent with what the signal shows: a loss several times the average win, which is how a payoff of 0.26 behaves, and with the vendor's own aggressive setting, where a stop is a larger share of the balance.
A pattern worth noting: the developer replies to almost every review with the same sentence, 'Thank you so much! Your review means the world to me.' That is polite and tells a buyer little. Read reviews for what they cannot do: they come from buyers a few weeks into use, and none of the ones we read gave a lot size, a broker and a verifiable result together.
The real price of Dynamic Liquidity Intelligence
The Market price on 17 October 2026 was $550, with the text 'Only 1 copies remain available at $550. The price will increase by $50 after every 10 purchases.' At the 24 purchases a month the listing shows, a step of 10 purchases comes about every 12 days, so the price would rise by roughly $120 a month if the rule is enforced. We cannot see when that text was written. There is no rental, and we found no refund terms; MQL5 Market purchases are generally final. A licence allows 20 activations.
Add the costs the sticker leaves out: a VPS, an ECN, RAW or Razor broker account, and capital that matches the risk setting you choose. The licence is 55% of the recommended $1,000 on the smallest recommended account, and 1.8 times the $300 minimum. The free demo is real (1,300 downloads) and removes most of the price risk of a test. On the signal itself, the subscription is 350 USD a month. Even if a copier's $5,000 account matched the signal's average monthly growth of 13.32%, that is about $666 a month against a $350 fee, before slippage and before the fact that the signal shows 'No data' for slippage.
Our store lists a Dynamic Liquidity Intelligence at its own price, as a separate sale with its own terms. We disclose that at the top because it affects how you should read this page. Whichever seller you consider, ask what the refund policy is, which version you are getting, and whether the record belongs to that version.
Can your account actually run it?
- Capital. The listing says $300 minimum and $500 to $1,000 recommended. The signal runs on $10,000. On the aggressive setting that matches $300, our scaling puts the drawdown near 39%, so treat the minimum as a technical floor and anything under about $1,000 as a test account.
- Account type. A hedging account is required, with ECN, RAW or Razor spreads. See our broker guide and gold guide.
- Broker match. The signal runs at Just2Trade-MT5; the listing does not name recommended brokers. Your spread and commission are not that account's.
- Leverage. 1:100 minimum, 1:500 recommended. Check what your regulator allows.
- Hosting. The listing recommends a VPS for continuous operation. See our VPS guide.
- Timeframe and symbol. M15 and XAUUSD only; the EA will not trade other symbols.
- Prop firms. The listing makes no prop-firm claim. A stop on every trade helps, but an 11.63% drawdown at the conservative setting is outside the limits of many challenges. Read how EAs and prop firms mix before trying.
Will it last?
About 30 weeks of data, one symbol and one timeframe give little to build durability on. The vendor is established in the sense of having 26 products and 26 signals, which also means attention is spread across a large catalogue. Version 2.27 was last updated on 17 July 2026, three months before we read it, so frequent early updates have slowed, which may mean it is stable or may mean it is idle. The logic is closed, there is no published backtest with stated settings and no multi-year result. The score is low and has room to rise.
What we could not see
We also could not confirm the price rule in practice: whether the price actually rises every ten purchases, how many copies have been sold at each step, or what the final price is. The 'only 1 copies remain' wording is the vendor's own.
Criterion by criterion: how the 48.5 was built
Each score below is out of 10, multiplied by the criterion's weight, and sits inside the tier described by the written scoring anchors. The reasoning is short on purpose; the sections above carry the evidence.
| Criterion | Score | Points | Why |
|---|---|---|---|
| Verified evidence (weight 20) | 5 / 10 | 10.0 | A platform-built MQL5 signal of 30 weeks and 247 trades earns real credit. Held back by a record under 12 months, vendor operation, an unknown version match and no monthly table. |
| Risk and drawdown (weight 20) | 6 / 10 | 12.0 | A stop on every trade by the vendor's description, consistent with the loss sizes, no grid or martingale, and a verified 11.63% balance drawdown. Held back by 36 losers, a 4.8% average loss, an unstated lot size and a drawdown that scales with the risk setting. Label Medium. |
| Profitability quality (weight 15) | 5 / 10 | 7.5 | Verified positive expectancy of $34.81 a trade and a profit factor of 1.49. Held back by a payoff of 0.26, a 5.7-point cushion over break-even and a profit factor near 1.35 without the best streak. |
| Sustainability (weight 15) | 4 / 10 | 6.0 | An established seller with updates, offset by closed logic, one symbol and timeframe, about 30 weeks of data and an update history that has slowed. |
| Transparency and trust (weight 10) | 4 / 10 | 4.0 | A public live signal and stated risk guidance, offset by a price that rises with sales, a 'copies remain' claim, template review replies and no manual or inputs documented before purchase. |
| Practical fit (weight 10) | 5 / 10 | 5.0 | Specific needs (hedging, ECN or RAW, VPS) and a $300 minimum that matches the aggressive setting, with a conservative setting as a workable mitigation. |
| Cost and value (weight 5) | 3 / 10 | 1.5 | A $550 licence that rises with sales, no rental and no refund terms, against a record under 12 months; the free demo is the mitigation. |
| Support and usability (weight 5) | 5 / 10 | 2.5 | A free demo and stated risk guidance, with replies that are polite but generic, and no manual or set file seen. |
Who it might suit, and who should walk away
It may suit an experienced gold trader with a RAW or ECN hedging account and a VPS, who will run the demo for months, size from the conservative end (0.01 lot per $1,000 or less), and treat any live money as the second stage of the test. A stop on every trade and a public signal give that buyer more to work with than most.
It does not suit anyone who would size from the $300 minimum, who is buying because 'only 1 copy remains', who expects the signal's 86% to repeat, or who cannot afford a drawdown of 20% or more. If you are unsure, start with our guide to spotting EA scams; this product is not one, but the checks are the same.
If you want to test it: a 12-week plan
Step 1: Open the signal yourself
Read the statistics, warnings and any monthly table on signal 2365511, and the three other signals at different account sizes. Compare the weeks, trades and drawdown with this verdict.
Step 2: Run the free demo on your own broker
Use a RAW or ECN hedging demo with the spreads you would trade. Log the spread at entry and how far each pending order fills from its price.
Step 3: Backtest on real ticks
Use XAUUSD M15 on your broker's data, with its real spread and commission. Note maximum equity drawdown and compare it with the signal's 11.63%. How to read the report.
Step 4: Forward-test for 12 weeks
A demo on the same broker, account type and VPS you would use live. Our forward-testing guide says what to log. Cover a bad stretch, not only a good one.
Step 5: Size from your own drawdown
Use your measured maximum drawdown, not the signal's, to choose between the three risk settings. Set a total-loss rule outside the EA.
Step 6: Start small, and only if it passed
Fund an amount you can lose completely, and treat the first live month as part of the test.
Ten questions to put to the vendor before you pay
A vendor with a real edge can answer these in a paragraph. Vague or missing answers are information too, and they are the fastest way to close the gaps this verdict could not.
- What lot size and risk setting does signal 2365511 use, and which version of the EA produced each part of the record?
- Why does MQL5 show an equity drawdown of 3.42% when the balance drawdown is 11.63%?
- What are the results of the other three live signals, and do they all run the same version?
- What does the record look like without the 26-trade winning streak?
- What is the refund policy, and what happens to a buyer whose results differ from the signal on their broker?
- Is the 'price rises $50 every 10 purchases' rule enforced, how many copies have been sold at each price, and what is the final price?
- Is there a manual, a list of inputs and a set file, and are they available before payment?
- What spread, commission and slippage did the signal average per trade, and how far do pending orders fill from their price?
- Why has the EA not been updated since 17 July 2026, and what is planned?
- Which brokers do you recommend, given the signal runs at Just2Trade?
What would move this score
- A 12-month verified record on the current version, with the monthly table visible and the lot size stated. This alone could lift evidence into the 7 to 8.5 tier.
- A profit factor above 1.5 and a payoff that improves, holding up without the best streak. That would move profitability up.
- Stress results at each risk setting, so the 39% estimate is replaced by a measured figure. This helps risk and fit.
- A refund path, a fixed price and a manual before purchase. These raise trust, cost and support together.
- Subscribers who copy the signal with published slippage data. Right now 'No data' is all the page can say.
- Downward risks: a deeper drawdown, a visible loss of the edge, a record that is reset, or no further updates.
The vendor, or any reader with the signal open, can send corrections through the contact page. We will recalculate and log the change with the date at the top of this page.
How it compares with the other verdicts
Next to Quantum Titan, which scored 51.0, Dynamic Liquidity Intelligence has a longer sample of trades (247 against 134) and a lower drawdown, but a lower profit factor (1.49 against 2.22) and a thinner cushion. Next to The Gold Reaper at 59.3, it has about a third of the history. It is a clear step above Wave Rider at 43.0, which defaults to a grid with a nine-trade signal, and Quantum Queen X at 36.5. For how these system types differ, see our strategy comparison and our gold category.
Sources and when they were opened
- MQL5 Signals: Dynamic Liquidity Intelligence R1000 (signal 2365511), opened 17 October 2026Source of every performance figure and platform warning in this verdict: growth, trades, drawdown, streaks, price and warning log. The vendor operates the account.
- MQL5 Market: Dynamic Liquidity Intelligence (product 169976), opened 17 October 2026Source of the price, version, requirements, risk guidance, reviews and the developer's replies. Written by the vendor.
- Myfxbook Help: VerificationHow a trading account's track record is verified on Myfxbook.
- MetaTrader 5 Help: Testing ReportWhat each figure in the tester's report means, including drawdown.
- MetaTrader 5 Help: Strategy TestingThe Strategy Tester: testing modes, settings and forward testing.
- CFTC Customer Advisory: AI Won't Turn Trading Bots into Money MachinesA US regulator's warning about trading-bot claims of unusually high returns.
Frequently asked questions
Is Dynamic Liquidity Intelligence EA legit?
It is a real product with a public MQL5 live signal built from broker trade history: +85.98% in 30 weeks, 247 trades, an 85.42% win rate, a profit factor of 1.49 and an 11.63% balance drawdown. The vendor says it uses a stop on every trade and no grid or martingale. We do not allege wrongdoing. The record is under a year and run by the seller, which is why it scores 48.5 out of 100.
What drawdown does Dynamic Liquidity Intelligence have?
The signal's worst balance drawdown is $1,822.51, or 11.63%, on a $10,000 account. The listing offers three risk settings, from 0.01 lot per $1,000 to 0.01 per $300, and the signal does not state its lot size. If lots scale with balance, our arithmetic puts the same sequence of trades at about 39% on the aggressive setting. Measure your own on a demo.
How much does Dynamic Liquidity Intelligence cost?
The MQL5 Market price on 17 October 2026 was $550, with a stated rule that the price rises by $50 after every 10 purchases, and no rental. A VPS and a RAW or ECN hedging account are extra, and the signal subscription is 350 USD a month. A free demo is available, and we found no refund terms.
Does Dynamic Liquidity Intelligence use grid or martingale?
The vendor says it uses no grid, no martingale and no position averaging, with a predefined stop loss and take profit on every trade. The signal's loss sizes, with the worst only about 24% above the average and at most two losses in a row, are consistent with that, but we have not seen the code or the trade list.
What is the minimum deposit for Dynamic Liquidity Intelligence?
The listing states $300 and recommends $500 to $1,000, with a hedging account and leverage of 1:100 or more. The $300 minimum corresponds to the aggressive setting of 0.01 lot per $300. Treat it as a technical floor, and plan on a few thousand dollars or treat any smaller account as a test.
Should I copy the Dynamic Liquidity Intelligence signal instead?
You can subscribe on MQL5 for 350 USD a month, and it had 0 subscribers when we read it. The page shows no slippage data, and the average trade lasts about two hours, so copying delays matter. At the signal's 13.32% average monthly growth, a $5,000 copier would earn about $666 a month against the $350 fee, before slippage. The signal is better used as a record to study.
How was the 48.5 score calculated?
Eight weighted criteria (evidence 20, risk 20, profitability 15, sustainability 15, trust 10, fit 10, cost 5, support 5), each scored out of ten against written anchors. Sources are graded A to D and unverified claims cannot count as proof. We sell a listing under this name, which is disclosed at the top, and the same method scored Quantum Titan at 51.0 and Wave Rider at 43.0.
Gold Expert Advisors in our store
We sell these, so weigh that interest. Put the same eight questions to any of them before you buy: read the manual, run your own backtest, and start on demo.



Keep reading
- EA Verdict #4Quantum Titan EA Review: Verdict and Risk (2026)Is Quantum Titan worth $1,299.99? Independent EA verdict: 51.0/100, Medium risk. Live signal, drawdown, trust and cost scored from sources opened 17 Oct 2026.
- EA Verdict #2The Gold Reaper EA Review: Verdict and Risk (2026)Is The Gold Reaper worth $949? Independent EA verdict: 59.3/100, Medium risk. Live signal, drawdown, trust and cost scored from sources opened 17 Oct 2026.
- EA Verdict #5Wave Rider EA Review: Verdict and Risk (2026)Is Wave Rider EA worth $249? Independent EA verdict: 43.0/100, High risk. Grid recovery, a three-week signal, reviews and cost scored, 17 Oct 2026.
- Strategy comparisonWhich EA Strategy Wins Long Term?Compare MT5 Expert Advisor strategy types, from scalping and grid to hedging and arbitrage: how each earns, how each fails, and which tend to survive long term.